
NEWS
Global Warming Has Accelerated to 0.35°C a Decade
Filtered temperature records show warming at 0.35°C a decade, dating a long-term 1.5°C breach between 2026 and 2029.

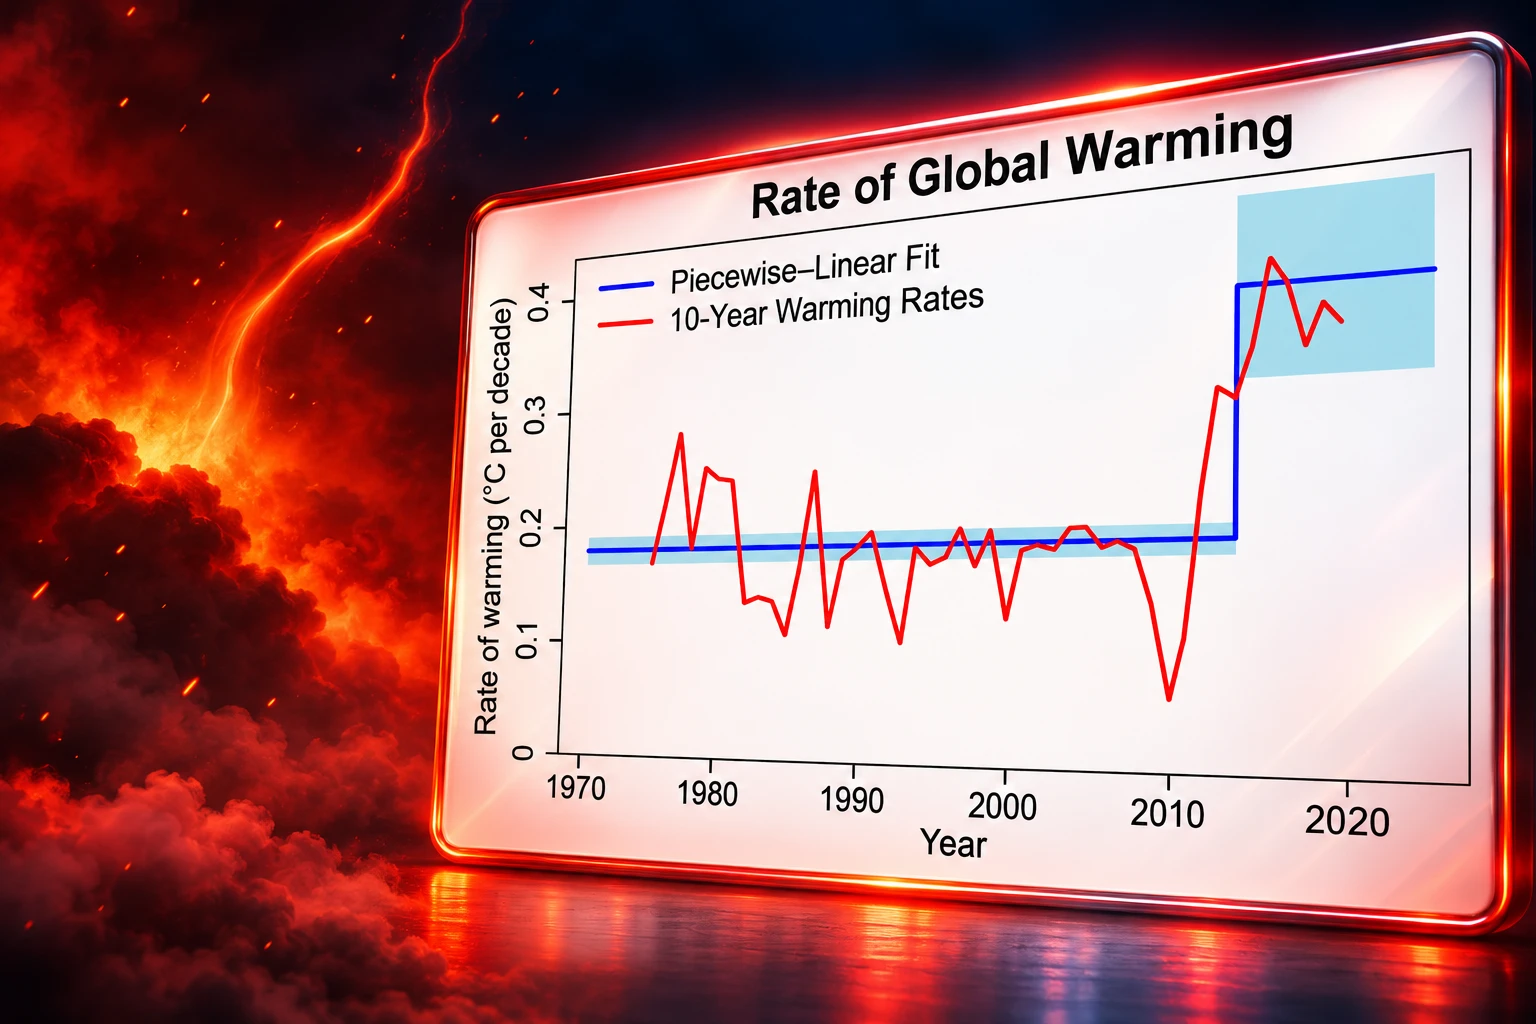
Earth has warmed at about 0.35°C per decade over the past 10 years, according to a Potsdam Institute for Climate Impact Research study. That is nearly twice the pace from 1970 to 2015, and it is the fastest decade in records that start in 1880.
Grant Foster, a retired U.S. statistician, and Stefan Rahmstorf, a PIK researcher, report a significant acceleration since 2015 after they stripped known natural swings out of the record. The second hit is the calendar: depending on the dataset, a long-term 1.5°C breach now sits between 2026 and 2029, while the paper still does not say which physical process added the extra heat.
The Same Faster Slope in Five Records
Detecting a change in the underlying pace is harder than lining up hot years. El Niño can dump Pacific heat into the air for a season. Big eruptions can shade the planet. The Sun’s roughly 11-year cycle changes how much energy arrives. Foster, formerly at Tempo Analytics and now based in Orono, Maine, calls that mix random noise sitting on top of the long-term signal.
THE NOISE THEY REMOVED
- El Niño and La Niña: The tropical Pacific can lift or cut global air temperature for a year or two without a lasting change in the trend.
- Volcanic eruptions: Particles high in the air bounce sunlight to space and can cool the surface for a stretch after a major blast.
- The solar cycle: A solar maximum, including the recent one, slightly raises the energy Earth takes in from the Sun.
The pair applied that filter, first used in a 2011 paper, to NASA, NOAA, HadCRUT, Berkeley Earth and ERA5. On the raw series, even with 2024 included, a new break after the 1970s still missed 95 percent confidence. On the cleaned series, both a curved (quadratic) trend and a piecewise line that lets the data pick the break date clear over 98 percent.
Rahmstorf said the adjusted data show the faster pace since 2015 “with a statistical certainty of over 98 percent, consistent across all data sets examined and independent of the analysis method chosen.” Foster said the point is not a single speed so much as a faster speed than before, and that the gap is not small.
Significant acceleration of global warming since 2015, finds news PIK study with @rahmstorf
Recent warming: around ~0.35°C per decade.
1970–2015 average: just under 0.2°C per decade.
➡️Current rate is higher than in any decade since records began in 1880.https://t.co/rmpIWmg4K6 pic.twitter.com/kQJGgfn9GK— Potsdam Institute for Climate Impact Research PIK (@PIK_Climate) March 6, 2026
ERA5’s 2026 Date and HadCRUT’s 2029
The piecewise dates cluster in 2013 and 2014, a year or two before the 2015 headline. PIK’s round number of about 0.35°C per decade is a mid-pack figure. Across the five records the post-break slopes run from 0.34°C to 0.42°C per decade, from tests on five temperature datasets published on 6 March 2026 in Geophysical Research Letters (volume 53, issue 5, DOI 10.1029/2025GL118804).
WARMING RATES AFTER THE FILTER
| Dataset | When the slope changed | Rate since then (°C per decade) | Midpoint year for 1.5°C |
|---|---|---|---|
| NASA | April 2013 | 0.36 | 2028 |
| NOAA | February 2013 | 0.36 | 2028 |
| HadCRUT | January 2014 | 0.34 | 2029 |
| Berkeley Earth | February 2014 | 0.36 | 2028 |
| ERA5 | February 2014 | 0.42 | 2026 |
Those “cross 1.5°C” years are not a single hot calendar year. Foster and Rahmstorf take the 20-year window whose average exceeds 1.5°C above the pre-industrial baseline, then report the midpoint of that window. ERA5, the Copernicus reanalysis, is the outlier on speed and the earliest on that midpoint. HadCRUT is the slowest of the five and the latest, in 2029. The spread is 2026 to 2029.
Rahmstorf’s public line, “before 2030,” is that same window stated as a bound. A year above 1.5°C, which several datasets have already logged, is a different test from that long-term average.
Copernicus Cut 24 Years off the Paris Clock
A separate Copernicus Climate Change Service note dated 29 October 2026, built on ERA5 and a simple 30-year extrapolation rather than Foster’s filter, shows how far the operational clock has moved since Paris. The service itself says the app is not a forecast, because a straight line cannot split greenhouse forcing from natural swings.
THE PARIS CLOCK IN ERA5
- December 2015: COP21 adopts the Paris Agreement. Copernicus puts global temperature at 1.04°C above the pre-industrial average and, on the trend then in hand, a 1.5°C mark in March 2042, 27 years away.
- January 2020: New International Maritime Organization fuel rules cut the sulfur cap on ships from 3.5 percent to 0.5 percent, cutting shipping sulfur dioxide by about 80 percent.
- 14 October 2024: Claudie Beaulieu and colleagues, using records through 2023 without Foster’s filter, find no second break after the 1970s.
- 6 March 2026: Foster and Rahmstorf publish the filtered result with over 98 percent confidence.
- 29 October 2026: Copernicus puts the current level at 1.44°C and, if the recent trend held, a 1.5°C threshold by January 2029, about three years away, 24 years closer than the 2015 projection.
On 9 November 2026 the Copernicus ECMWF account repeated the same arc: the 2015 projection was 2042, and the monitor now puts the breach inside this decade. January 2029 and Foster’s 2026 to 2029 range are not the same math. One is an unfiltered 30-year line on ERA5. The other is a 20-year midpoint on cleaned data. They still land in the same few years.
The Copernicus note also flags 2023, 2024 and 2025 as the three warmest years in most global datasets, including ERA5, and points to a United Nations Environment Programme assessment from October 2026 that treats a temporary move through 1.5°C as unavoidable. That report’s lowest overshoot path still sees 1.7°C to 1.8°C by mid-century.
Why 2023 and 2024 Do Not Carry the Finding
The obvious objection is that two blistering years can tilt a decade. Foster and Rahmstorf tested that directly. After they took El Niño and the solar maximum out, 2023 and 2024 came in cooler than the raw readings, yet they remained the two warmest years since instruments began. Signs of a faster slope were already showing in 2013 or 2014 in every dataset they used, which is why a 2023-only spike cannot be the whole story.
The study was built to test the rate, not the physics. Climate models, the authors note, can produce a rising rate, so the result does not, on its own, mean those models are broken. It also does not tell a government which lever moved.
If the warming rate of the past 10 years continues, it would lead to a long-term exceedance of the 1.5°C limit of the Paris Agreement before 2030. How quickly the Earth continues to warm ultimately depends on how rapidly we reduce global CO2 emissions from fossil fuels to zero.
Stefan Rahmstorf, PIK researcher and lead author, Potsdam Institute release
Foster is blunter about the method’s limit. The El Niño, volcano and solar adjustments are “empirically based, but approximate and imperfect,” he said, because they come from past index values matched to past temperatures, not from a full physical model.
Beaulieu Needed a 55% Jump to Call It a Surge
The statistical fight is older than this paper. On 14 October 2024, Beaulieu, a professor of ocean sciences at the University of California, Santa Cruz, with Colin Gallagher, Rebecca Killick, Robert Lund and Xueheng Shi, concluded in Communications Earth & Environment that a recent surge is not detectable yet in four surface records through 2023. Their changepoint tools still saw one shift near 1970. They estimated that the recent rate would have to jump by at least 55 percent before a new surge would clear their test with the data then in hand.
Foster calls that 2024 paper excellent and says it was a close call on unadjusted data. His reply is the filter: once the noise is down, the same kind of test finds a 2013 or 2014 break. Beaulieu has praised the fact that the new signal shows up in all five records, then warned that the faster pace “may prove temporary” and that several more years of monitoring will be needed to know if it is a lasting shift.
WHERE EXPERTS DISAGREE
- Foster and Rahmstorf: After the filter, the rise in rate is strong enough to call, at 0.34°C to 0.42°C per decade depending on the record.
- Piers Forster and the IGCC group: Human-caused warming is about 0.27°C per decade for 2016 to 2025. Forster, director of the Priestley Centre for Climate Futures at the University of Leeds, said “accelerating” is emotive and hard in the math, and that he would rather say “unprecedented rates of warming,” which does not claim the rate will keep rising.
- Michael Mann and Zeke Hausfather: Mann, a professor of Earth and environmental science at the University of Pennsylvania, said the planet is warming at a roughly constant rate until carbon emissions hit zero, and that recent spikes were El Niño on top of less aerosol cooling. Hausfather, a climate scientist, said taking El Niño out of surface records is “more of an art than a science,” and that he is skeptical the forced response over the last decade is 0.35°C rather than the 0.27°C in the Indicators of Global Climate Change estimate.
Those 0.27°C and 0.35°C figures are not a failed sum. One is human-induced warming in the IGCC series. The other is the slope of filtered global mean surface temperature. Researchers who had stayed cautious about using the word surge now have a cleaned record that looks like a break from a straight line, and a second camp that still treats 0.27°C as the safer forced rate.
Cleaner Ship Fuel and the Missing Mechanism
The missing piece is why the slope bent. Greenhouse gas levels are still rising, which remains the main driver in every Copernicus and IGCC update, but that alone does not sort a change around 2013 to 2015 from a change around 2020. Earth’s energy imbalance, the gap between incoming and outgoing radiation, has also climbed in recent years, which is consistent with more heat staying in the system and does not, by itself, name the agent.
The candidate that has drawn the most new papers is not a secret extra source of CO2. It is cleaner air. Sulfate particles from coal plants and from ships have long dimmed sunlight and seeded brighter clouds. As that haze thins, greenhouse warming that was already in the pipeline shows up faster at the surface. China’s air-quality drive is one long decline. The sharper 2020 step is IMO 2020, the marine sulfur cap.
Estimates of how much extra warmth that cap added do not agree, which is why it cannot be dropped into the Foster paper as the cause. One set of model results puts the extra global heat near 0.03°C, inside ordinary variability. Other studies put it around 0.05°C over this decade, about two or three years of background warming. A higher estimate is about 0.16°C over seven years. Gettelman and colleagues have reported about 0.12 watts per square meter of extra forcing from the shipping change. A 2026 preprint argues that several global models understate that forcing because of how they inject sulfate. Foster and Rahmstorf did not test any of those numbers.
That gap matters for policy more than for the existence of a faster slope. If a large share of the extra 0.15°C per decade is unmasked aerosol cooling, the rate can ease once the one-time clean-air step has played out. If most of it is a stronger greenhouse or cloud response, the 0.34°C to 0.42°C band is a better guide to the next few years. The study leaves both doors open.
130 Gigatonnes Left for 1.5°C
The temperature clock and the carbon clock are now both short, and they are not the same instrument. Indicators of Global Climate Change, led by Forster, put human-induced warming at 1.37°C in 2025, rising at about 0.27°C per decade for 2016 to 2025. From the start of 2026 the same update gives a remaining budget of 130 Gt of CO2 for a 50 percent shot at 1.5°C, enough for around three years at current emission levels. Global greenhouse gas emissions were 56.8 billion tonnes of CO2 equivalent in 2024.
THE TWO SHORT CLOCKS
- Filtered surface rate: About 0.35°C per decade, with a long-term 1.5°C midpoint between 2026 and 2029 if that slope holds.
- Human-induced rate: About 0.27°C per decade in the 2016 to 2025 IGCC window, which still puts 1.5°C around 2030 if emissions stay high.
- CO2 budget: 130 gigatonnes from the start of 2026 for a 50 percent chance at 1.5°C, about three years of present-day output.
- Operational ERA5 line: 1.44°C now, January 2029 if the recent 30-year trend is extended, with the service’s own warning that this is not a prediction.
A budget of 130 gigatonnes can run out even if a given year dips below 1.5°C at the surface, because CO2 stays in the air. A 20-year temperature average can cross 1.5°C even if the next La Niña takes a couple of tenths off a single season. Neither clock needs the Foster result to be scary. The paper’s addition is that, once the usual excuses in the temperature series are taken out, the faster surface slope is no longer a visual hunch.
C3S data already show record heat in the Niño 3.4 region of the Pacific since May 2026, beyond the 1982, 1997, 2015 and 2023 events, so the next raw annual number will again mix a faster baseline with a natural spike. The filtered records were built for exactly that mix. They still leave the cause of the extra 0.15°C per decade unnamed, and they still put a long-term 1.5°C breach inside this decade if the new slope holds.

Pattinson Gets Bond After Bezos Called Him Too Famous

REO’s $21,500 Runabout Is a Two-Year, 50,000-Person Bet

Voyager 1 Reaches One Light-Day as Earth Falls Behind

Best Latin Song Arrives After Rosalía Reaches the Big Three

Tyson Shrinks Beef to Three Plants After a $654 Million Loss

Meta’s Smart Glasses Sell a Light That Needed Two Patches

Apple’s New Mac Studio Clusters Local AI on the Desk

Google’s Free AI Pro Year Is Three Different Deals

Song Yadong Stops Umar Nurmagomedov the Only Way Left

Lanterns Puts Sinestro in a Cell and Lets Him Talk
-
 NEWS3 months ago
Meta’s Smart Glasses Sell a Light That Needed Two Patches
-
 NEWS3 months ago
Apple’s New Mac Studio Clusters Local AI on the Desk
-
 NEWS3 months ago
Google’s Free AI Pro Year Is Three Different Deals
-
 NEWS3 months ago
Song Yadong Stops Umar Nurmagomedov the Only Way Left
-
 ENTERTAINMENT3 months ago
Lanterns Puts Sinestro in a Cell and Lets Him Talk
-

 NEWS3 months ago
The Mahape Fake Apple Raid Repeats a Dual-Shift Pattern
-

 ENTERTAINMENT3 months ago
LUN8’s First London Concert Filled a 620-Cap Club
-

 NEWS3 months ago
OpenAI Agents Hit Hugging Face to Cheat a Test